NEPLAN | ERIS- Evaluation of Reliability Index for Electric Systems
back to overview
The operation of a lean, supply-safe network is becoming increasingly important for grid operators. The importance of quantitative assessment of supply security is increasing. With ERIS (Evaluation of Reliability Index for Electric Systems), you receive an ideal tool for network planning and development as well as for the systematic determination and measurement of supply security during operation. ERIS helps to quantify the security of supply. ERIS can also be used to measure the impact of expansion and renewal investments.
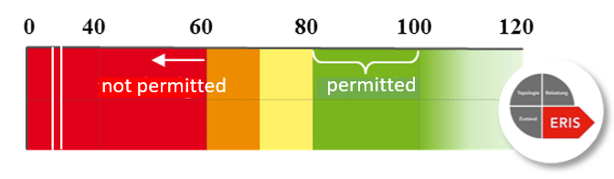
ERIS gives security of supply a value that can be used for the targeted network and the renewal planning. ERIS is a non-uniform number between 0 and 120, whereby 120 corresponds to an ideal network. If a network variant has a value greater than 100, the security of supply is above average (overcrowded). Conversely, ERIS values below 80 require action. A value less than 60 is not permitted.
The ranges result from the set planning principles. This allows you to define your specific supply security requirements. Adjustable planning principles include, among other things, the maximum permissible line load or the targeted proportion of the switchgear systems that are better than (n-1) connected.

With ERIS you can:
- Measure the security of supply
- Recognize the need for action
- Compare variants
- Place loads depending on the expected development
- Define the time of renewals
- Prioritizing network expansion and renewal measures from a single source
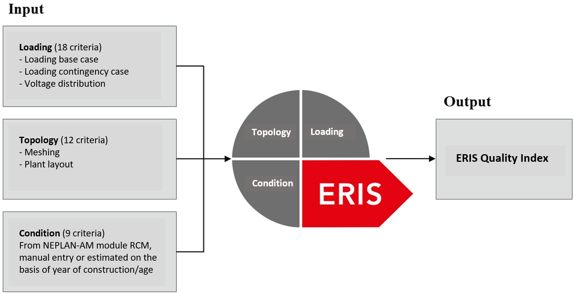
The assessment is based on the three main categories of loading, topology and condition. This means that all network-relevant criteria for the evaluation of a network or subnetwork are taken into account.

NEPLAN | Protection Data Management System (PDMS)
back to overview
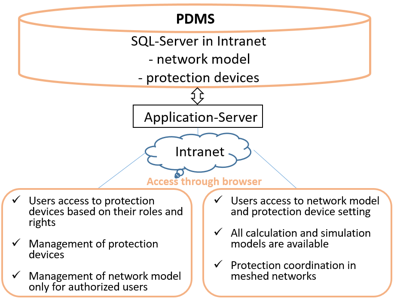
PDMS is a browser-based management software that allows the user to create, modify and delete protection devices, manage existing protection libraries or add new ones and keep history of all changes in the master database.
Apart from parameters used for creating characteristics, PDMS also handles additional parameters that ensure the correct behavior of the protection devices in the field. All parameters can be imported from Excel lists or XML files and are accessible through dialogs.
Using a sophisticated user administration scheme, PDMS offers different types of accessibility to the master data base that contains the complete network model and all protection devices. Intranet users have direct access to PDMS database. Desktop users store their project in a local database with bidirectional communication with the PDMS database.
There are three type of users, with access to the Protection Data Management System (PDMS):
- Users able to change the network model
- Users able to manage the protection device (adding, modifying, setting)
- Desktop Users or Intranet users able to perform power system analysis and relay settings as well as to update the master database
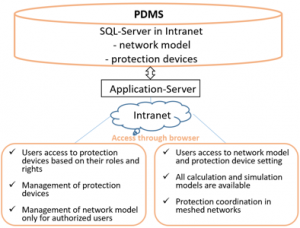
The complete network that is stored on the intranet server contains primary and secondary components, that means transmission network with all sub and power stations:
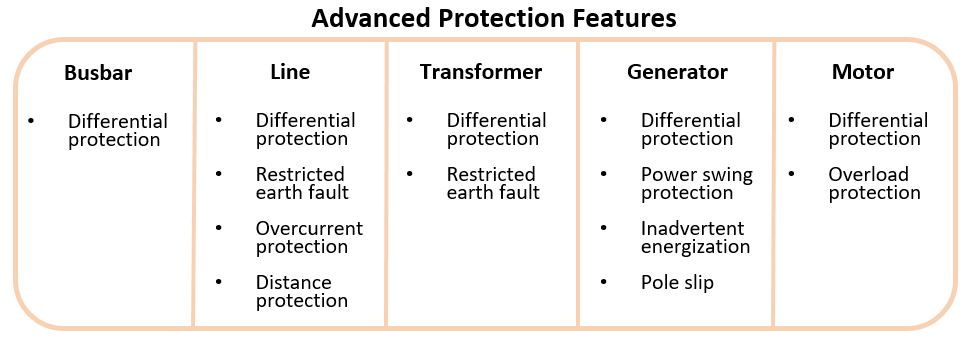
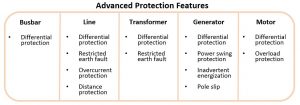
- All protection devices (over current, distance, differential, transformer, generator, etc.) with current and voltage transformers
- Controllers (AVR, PSS, governors, turbines, HVDC controllers, etc.)
The protection devices are accessible directly from the single line diagram or from a tree view list and they can be assigned the following data:
- Location related to the network model (sub station, voltage level, bay)
- Setting parameter, which are used for creating the tripping characteristic
- Additional parameters of the protection device
- Hyperlinks to protection manuals in PDF-format
- Hyperlinks to comtrade files
NEPLAN offers the following advantages:
- Management of any protection devices on the network plan in a multi-user environment
- Integrated adjustment and coordination of protection devices in meshed networks
- Predefined and user-defined protection device models and extensive protection device library
- Storage of any information such as files, manuals and test reports
- Protection coordination with selectivity diagram and tripping schedule
- Macro language for protection device modeling for dynamic analysis
NEPLAN | Voltage Stability
back to overview
This module is an ideal tool to provide insight into the nature of voltage stability problems. It allows the examination of a wide range of system conditions providing four approaches for static voltage stability analysis of power systems: V-Q curves, P-V curves, V-Q sensitivity analysis and Q-V eigenvalue analysis (modal analysis).
General Characteristics
- Automatic calculation of P-V curves, V-Q curves, dV/dQ self-sensitivities, dV/dQ mutual sensitivities, eigenvalues, eigenvectors, bus participation factors, branch participation factors and generator participation factors.
- Result tables: results are presented in clear form and can be exported by Copy-Paste-methods to external programs (e.g. MS-Excel).
- Graphical results: results can be visualized by the fully integrated graphical results manager.
- Export files: results are stored in text files for advanced data export.
- Charts can be easily printed and exported to external programs (e.g. MS-Word) by clipboard functions. A variety of chart options is available.
- Input: standard load flow input data
Applications
- Identification of weak / not controllable / unstable areas
- Identification of weak and heavily loaded links
- Proper distribution of reactive reserves in order to maintain an adequate voltage stability margin
- Voltage sensitivity information
- Degree of voltage stability
- Most effective measures in improving voltage stability
NEPLAN | Water basic module
back to overview
This basic module enables the user to model, design and optimize his water network using NEPLAN’s famous graphical interface and NEPLAN’s powerful, up-to-date calculation algorithms to address a wide range of applications.
General Characteristics
- Powerful, up-to-date calculation algorithms (including Newton-Raphson and Hardy-Cross)
- Simulation of any kind and size of networks
- No restriction on number of nodes and elements
- Simultaneous calculation of any number of partial networks (independent networks)
- Calculation with load factor profiles (day, week, season, weekdays, Sundays, long term, etc.)
- Import of measured consumption data
- Changing demands through global, regional or simultaneity load factors
- To each pipe any number of line loads can be connected (e.g. houses, industrial , …)
- Calculation of centrifugal and circulation pumps, reservoirs, valves, fittings etc.
- Sophisticated valve models
- Calculation of multiple pumps, tanks and reservoirs
- Calculation with different water temperatures
- The head loss characteristics of the pipes are calculated according to Darcy, Prandtl-Colebrook and Hagen-Poiseuille
- Time dependent load and reservoir height characteristics (e.g. at night, or at noon, summer, winter etc.)
Results
Upon calculations, results are automatically displayed on the single line diagram while their content and graphical information can be customized. Result evaluation and processing is easier due to visualization functions:
- Coloring according to variable ranges (e.g. velocity, flow, pressure-losses, pressure etc.)
- Highlighting of overloaded elements (e.g. velocity v > v max)
- Line width proportionally to many variables, including the flow and diameter
- Result output to an excel like table sheet, with copy/past possibilities to MS-Excel
- Output to ASCII files or SQL database for further evaluation (e.g. MS-Excel)
- Display results in a sophisticated chart manager (e.g. bar or line chart)
- Result boxes can be moved, deleted, sized, colored and hided
- Self-defined result output: the user can select variables, font, precision, placement
- Comparing results was never easier: Results from other variants can be displayed in the same result label and in the same chart
NEPLAN | Technical Databases
back to overview
Data storing
In the browser-based version of NEPLAN V10/360 all data associated to the projects is stored in a relational database. In case the user connects to NEPLAN through the cloud he doesn’t have to care about that. In case the software is installed in the intranet a SQL database has to be installed for this purpose.
Version V5.x of NEPLAN stores the data locally in an internal database.
Interfaces
To be interoperable with other systems, NEPLAN offers several ways to export, import and access data:
- Direct access to calculation modules of NEPLAN with webservices (NEPLAN V10/360) and NEPLAN Programming Library (NPL, NEPLAN V5.x)
- Import data from GIS and SCADA systems (CDE)
- Import UCTE data
- Import CIM ENTSO-E data
- For NEPLAN V10/360, which stores its data in a relational database import and export to local file
- For NEPLAN V5.x export and import to SQL-database and ASCII files
NEPLAN | Time simulation
back to overview
This module enables the user to model time dependent processes using factor profiles or measurements for all consuming or supplying elements.
General Characteristics and Results
- Simulation of reservoir filling and emptying process
- Defining events such as: “if flow in pipe a below a certain value, disconnect pipe b»
- Simulation of any kind and size of networks
- No restriction on number of nodes and elements
- Simultaneous calculation of any number of partial networks
- Calculation with load factor profiles (day, week, season, weekdays, Sundays, long term, etc.)
- Import of measured consumption data
- Documentation of the processes in excel like table sheets and in user defined time diagram charts
- To each node an individual load profile can be defined (day, week, season, weekdays, Sundays, etc.)
- Considering time characteristics for reservoirs for supply, outflow and water height (day, week, season, weekdays, Sundays, long term etc.)
NEPLAN | Reliability Analysis
back to overview
Reliability Analysis module is used to determine the frequency, average duration and cost of network component failures, leading to supply interruptions. Analysis takes into consideration the outage behaviour of network equipment (failure rate and repair times), the network operation in normal state and for multiple order network contingencies. Admissible short-time component overloading are also accounted for. Realistic generation patterns and load curves are used while the module implements a protection concept including protection failures.
Contingencies dealt with can be stochastic failures or overlapping independent stochastic failures, common-mode failures, protection failure or overfunction, multiple earth faults, spontaneous protection tripping, or failure occurring during the maintenance of the backup components.
Applications
- Optimal asset allocation and cost-benefit analysis for investments in transmission and distribution networks
- Design and evaluation of innovative substation layouts
- Weak-point analysis in existing networks
- Design of automation concepts in public and industrial distribution networks
- Detailed and objective discussion of network connection concepts for high-demand customers and power plants
- Cost-effective mitigation of power quality problems (voltage sags)
- Add-on for NEPLAN-Main – a tool to apply Reliability Centred Maintenance (RCM) Strategy, which leads to substantial reduction of maintenance expenses
Results
Result values are printed at load nodes in network graph, which can be colour shaded according to the Reliability Analysis outcome. Results are fully exportable for use in tables and diagrams and comprise of:
- Frequency of supply interruptions
- Probability of supply interruptions
- Mean interruption durations
- Energy not served in time
- Interruption cost
Evaluation Functions
Reliability Analysis module provides various flexible filter and diagram functions to visualize results and facilitate analysis:
- Consideration of power/energy-specific interruption cost
- Filter to investigate component contributions to load node interruptions
- Shading of network diagram in dependence of load node results
- Analysis of system reaction after faults
- Copying of diagrams into clipboard
NEPLAN | Reliability Centered Maintenance Module (RCM)
back to overview
Due to radical changes taking place in the energy markets the affected companies feel a constantly rising pressure to cut costs. Among others, there is considerable potential for this in the field of maintenance. Selecting a suitable maintenance strategy can result in a substantial reduction of maintenance costs without putting the required functionality at risk.
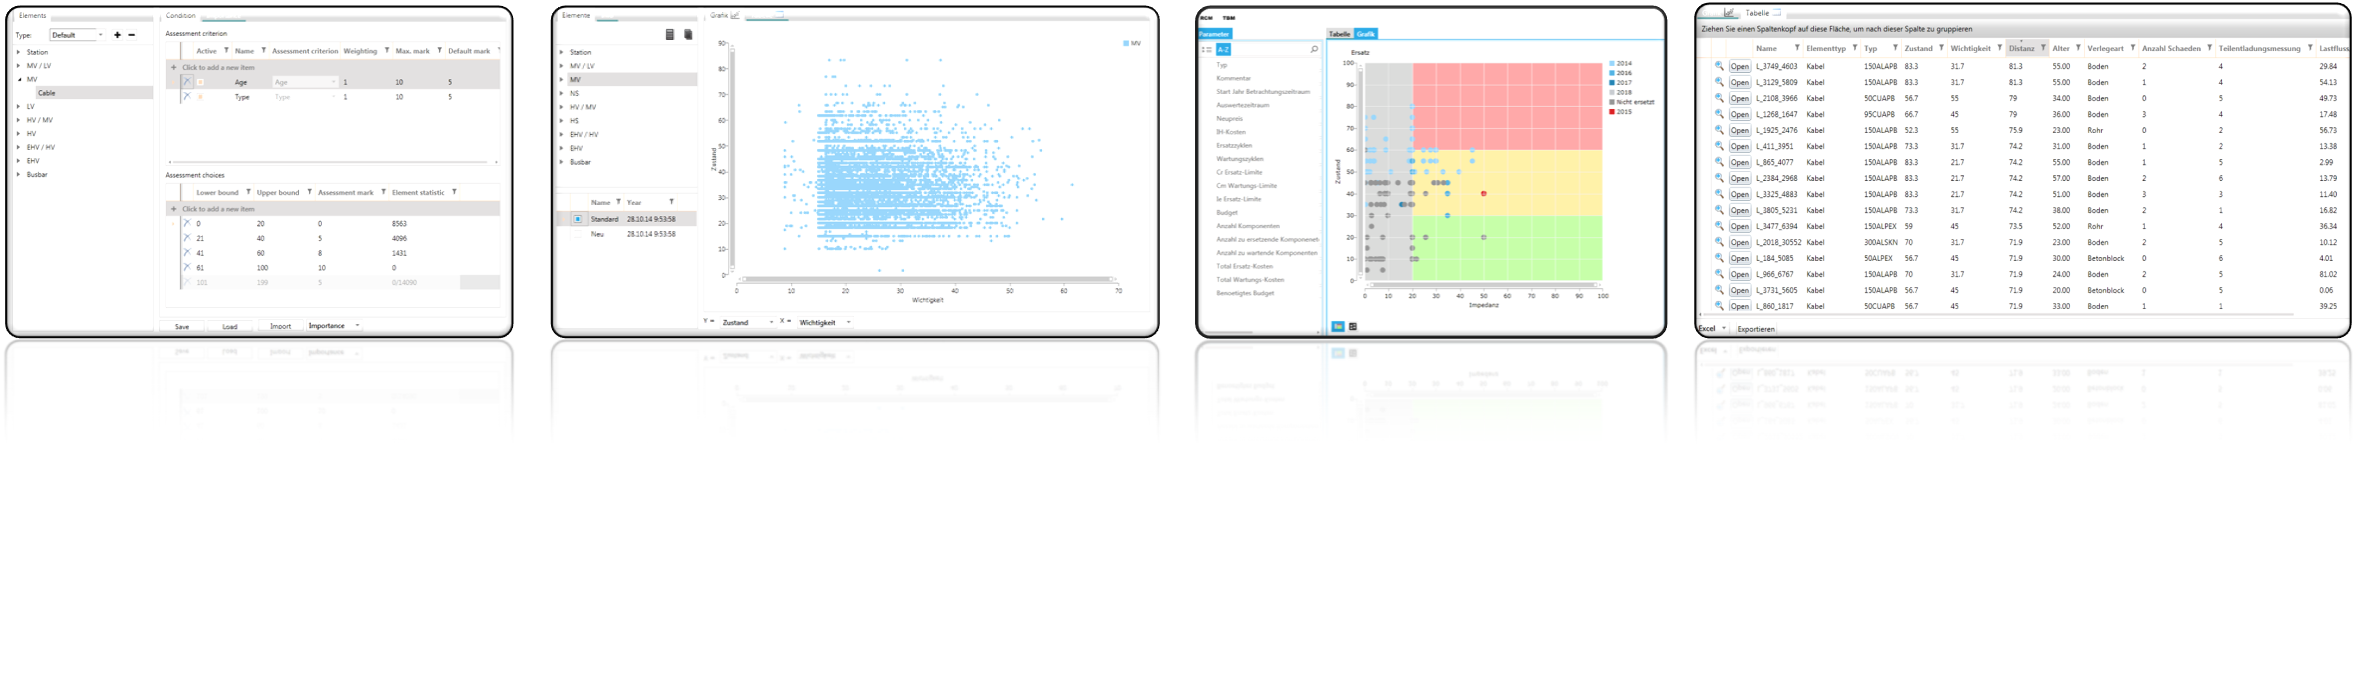
In order to achieve the required cost savings, an individual, accurate and verifiable valuation of assets is essential. This module allows the user to evaluate each asset with a self defined assessment system and realize an effective short and middle term maintenance planing.
General Characteristics
- Data can be stored in any database (e.g. Oracle, MS-Access, SQL Server etc.) or directly in a NEPLAN file
- Allows easy integration to existing ERP systems (e.g. SAP)
- Assessment criterion can be added or changed by the user
- Allows quickly to assess the conditions of the components
- Different charts give a useful overview over the overall conditions of the components
- A budgeting evaluation tools is available, which calculates the costs for the following maintenance strategies:
- TBM Estimation (estimated time based maintenance)
- TBM (time based maintenance)
- CBM (condition based maintenance)
- RCM (reliability based maintenance)
- Integrates smoothly with our famous NEPLAN-Reliability module
- Using the RCM module in NEPLAN any calculation result can be used to calculate condition or importance (e.g. use calculated loadings for lines, ENS (Energy Not Supplied), … )
- Can be excellently used for reinvestment strategies
Results
Due to NEPLANs up-to-date technology and advanced visualization functions the evaluation and processing of results was never easier.
- Display asset valuation results for each asset individually
- The style of each diagram is customizable and can be saved and reloaded if necessary
- Show results in diagrams or tables
- Export of tables to ASCII files or MS-Excel
- Export of diagrams to jpeg
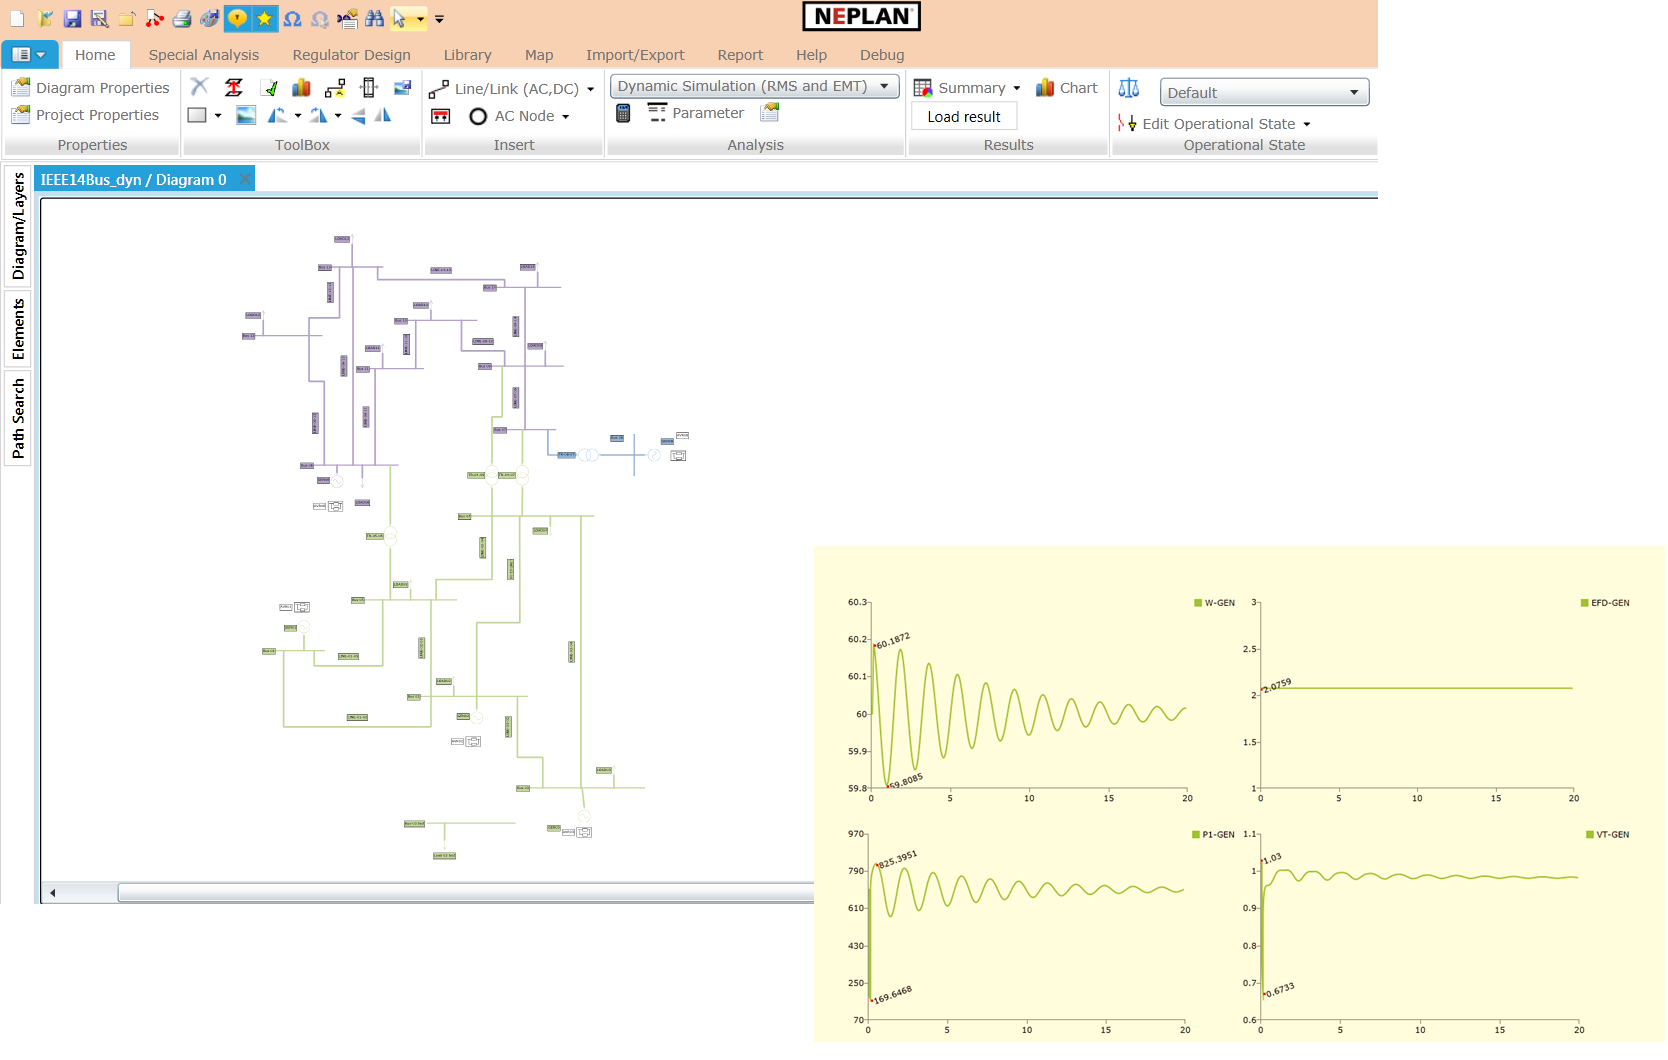
NEPLAN | RMS Calculation
back to overview
The RMS calculation is available in two different simulation frames, DQ0 and ABC.
The RMS mode is used for transient stability or electromechanical simulation, where the electrical model quantities are described by their fundamental frequency components. The DQ0 mode can be used in case of balanced systems with balanced or unbalanced faults. RMS-DQ0 is the preferable solution for typical stability studies. The ABC mode however is more flexible and should be used in case of asymmetrical or unbalanced network conditions.

NEPLAN | Small Signal Stability
back to overview
The NEPLAN Small Signal Stability module offers eigenvalue analysis (modal analysis) for electrical power systems. It provides information about the inherent dynamic characteristics of the power system and assists in its design. It is typically used in studies of interarea oscillations. It combines exceptional ease of use with the latest techniques and standards in both electrical power engineering and software design.
General Characteristics
- Data scanning and eigenvalue sensitivity functions
- Automatic construction of the linearized state space notation for the complete system, including generators, static loads, control circuits, etc.
- Advanced synchronous machine modelling. Selection for every synchronous machine of one of the five models: infinite, classical, transient, subtransient and general. Saturation curves for both, d-axis and q-axis
- Automatic calculation of eigenvalues, eigenvectors, mode shapes, participation factors for eigenvalues and state variables
- Text results: results are presented in clear form and can be customized by several output options
- Graphical results: results can be visualized by the fully integrated graphical results manager. Charts can be easily printed and exported to external programs (e.g. Microsoft Word) by clipboard functions. A variety of chart options is available
- The only requirement is the NEPLAN Load Flow module. However, the Small Signal Stability and the Transient Stability (Dynamic Simulation) module of NEPLAN complement each other ideally
- The Small Signal Stability module is completely integrated in NEPLAN and uses standard dynamic element data.
Applications
- Analysis of interarea oscillations
- Analysis of interplant oscillations
- Analysis of subsynchronous oscillations/resonance (SSR)
- Identification of groups and subgroups of machines swinging against each other
- Determination and improvement of power oscillation damping
- Design and placement of control equipment, such as Power System Stabilizers (PSS)
- PSS tuning