NEPLAN | Optimal Network Restoration Strategy
back to overview
This module is designed to study the impact of single forced (e.g. fault on a line) or planned outages on the electrical distribution system. It finds the optimal switching plan to restore electrical power to customers. It may be used as an off-line application to pre-define strategies in case of outages or as an on-line application to help the network operator find quickly the correct strategy after a fault has occurred.
The following objective functions are implemented:
- Minimize network losses
- Minimize the number of overloaded elements
- Minimize the average loadings of the elements
- Maximize the average voltage
Restoration Stages
- Four stages in the restoration strategy will be evaluated and may be stored in a fault history database:
- Occurrence of the fault
- Isolation of the fault. NEPLAN shows the unsupplied customers
- Re-supply of customers which are affected by the fault. NEPLAN shows which customer are re-supplied again
- Normalization of the network after the repair of the fault
- All stages of the selected optimal restoration plan with the new switch positions will be graphically displayed on the single line diagram
DMS On-Line Application
- Results with the new switch positions of all re-supply stages, including all objective functions are displayed as spreadsheet tables or can be accessed as text file for further evaluation (e.g. in DMS applications)
- All dialogues and restoration algorithms are available through a C/C++ API, the NPL – NEPLAN Programming Library. With NPL NEPLAN data and functions can be accessed with a user written C/C++ program. This allows building up customized restoration strategies for network operators
NEPLAN | Phase Swapping / Balance
back to overview
The purpose of this module is to reduce the unbalance in the phases by re-phasing single/two phase loads and lines. Re-phasing is performed in order to:
- Minimize the kW losses
- Minimize kVA unbalance (apparent power)
- Minimize A unbalance (current)
General Characteristics
- Maximum number of swapping can be defined
- Re-phasing works feeder-oriented (multiple feeder selection possible)
- Shows the unbalance and losses before and after re-phasing
- Option for manual re-phasing
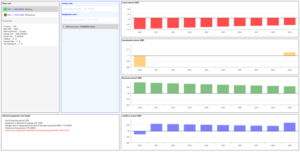
Results

NEPLAN | Optimal Capacitor Placement
back to overview
Whenever reactive power compensation (capacitors) is required in radial networks, the module Optimal Capacitor Placement can be of a great value to determine optimal locations, number and sizes of capacitors. The optimization is performed to minimize active power losses and to improve voltage profiles across defined feeders and it is applicable for radial networks.
If constraints in size step, location or total number of installations exist, they are treated and respected.
NEPLAN Optimal Capacitor Placement can calculate also the most economical set of capacitors after the optimization, by evaluating each capacitor as investment versus the reduction in losses cost.
NEPLAN | Investment Analysis (Present Value)
back to overview
With the module Investment Analysis, proposed investment plans can be evaluated and compared for determining the most financially viable option.
The calculation is performed with the Net Present Value as basis. The required financial input data are provided by the user e.g. discount rate, energy cost, maintenance costs etc. while the technical required data are calculated, e.g. losses, energy consumption, etc.
The outcome is a complete techno-financial evaluation and the user has a transparent image of each investment plan. This helps to find the costs-optimal solution.
General Characteristics
- Various secondary indexes are available e.g. Pay Back Period, Internal Rate of Return etc.
- Losses are calculated on an annual basis and the energy is estimated
- Consideration of load-dependent costs (copper losses) and of load-independent costs (magnetization, weather-dependent corona, and dielectric losses)
- Equipment’s investment data with sub-component costs are available in libraries.
- Revenues from energy selling are considered.
- Results are shown not only in tables but also in charts for intuitive assessment and comparison.
- and more…
NEPLAN | Multi-periode and N-1 constrained Optimal Power
back to overview
With the Optimal Power Flow module, the operation of a network can be optimized according to objective functions set by the user. The optimal solution ensures also that all variables (voltages, loadings etc.) are within allowed limits. There are various objective functions which can be used such as active power losses, generation production cost and many more, and these can be also combined in a multi-objective optimization.
The optimization can be performed for a given status of a network or for a desired time frame (multi-period).
Additionally NEPLAN features also Security Constrained Optimization (with n-1 contingency constraints) to determine not only optimal but also secure solutions.
State of the art mathematical solvers are used to guaranty robustness and top performance for highly complex optimization problems.
General Characteristics
- OPF models e.g. for synchronous machines, regulating transformers, HVDC systems and FACTS (UPFC, STATCOM, SVC, TCSC).
- Variable limits setting and conforming.
- Flexible limits setting, individual or general.
- Solution can be found for a whole network or for a part (area or zone).
- Several objectives functions which can be combined with weighting factors.
- Security constrained optimization (with N-1 contingency constraints).
- Multi-period OPF.
- and more…
NEPLAN | Flicker Analysis
back to overview
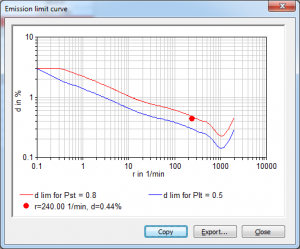
The Flicker Analysis calculates the voltage change and short-term and long-term flicker intensity caused by permanent load (current) change of a component at the point of connection.
The components connected to the network could be consumers, but also renewable energy sources, like wind power plant. The decisive input parameters are the change of current, its power factor and the repeat rate of this change per minute. Based on this input values the voltage drop and flicker will be calculated.
General Characteristic
- Considers 1-phase, 2-phase or 3-phase flicker causing components
- Calculation of voltage drop or rise dU
- Calculation of short term flicker intensity Pst and long term flicker intensity Plt
- Considering different kind of voltage change characteristics
- Flicker intensity calculation according to an analytical method possible
- Summation of all flicker causing components in the network
- Summation of measured flicker values with new flicker-causing components
- Evaluation of the limits given by standards
- Special treatment of wind power plants
- Graphical result output with the flicker emission limit curve
NEPLAN | Reliability Analysis
back to overview
Reliability Analysis module is used to determine the frequency, average duration and cost of network component failures, leading to supply interruptions. Analysis takes into consideration the outage behaviour of network equipment (failure rate and repair times), the network operation in normal state and for multiple order network contingencies. Admissible short-time component overloading are also accounted for. Realistic generation patterns and load curves are used while the module implements a protection concept including protection failures.
Contingencies dealt with can be stochastic failures or overlapping independent stochastic failures, common-mode failures, protection failure or overfunction, multiple earth faults, spontaneous protection tripping, or failure occurring during the maintenance of the backup components.
Applications
- Optimal asset allocation and cost-benefit analysis for investments in transmission and distribution networks
- Design and evaluation of innovative substation layouts
- Weak-point analysis in existing networks
- Design of automation concepts in public and industrial distribution networks
- Detailed and objective discussion of network connection concepts for high-demand customers and power plants
- Cost-effective mitigation of power quality problems (voltage sags)
- Add-on for NEPLAN-Main – a tool to apply Reliability Centred Maintenance (RCM) Strategy, which leads to substantial reduction of maintenance expenses
Results
Result values are printed at load nodes in network graph, which can be colour shaded according to the Reliability Analysis outcome. Results are fully exportable for use in tables and diagrams and comprise of:
- Frequency of supply interruptions
- Probability of supply interruptions
- Mean interruption durations
- Energy not served in time
- Interruption cost
Evaluation Functions
Reliability Analysis module provides various flexible filter and diagram functions to visualize results and facilitate analysis:
- Consideration of power/energy-specific interruption cost
- Filter to investigate component contributions to load node interruptions
- Shading of network diagram in dependence of load node results
- Analysis of system reaction after faults
- Copying of diagrams into clipboard
NEPLAN | Harmonic Analysis
back to overview
Harmonic Analysis can be performed in 3-phase, 2-phase, 1-phase AC systems to test the operating behaviour of the networks at frequencies above 50/60 Hz. The module can be used to compute the network impedance and harmonic level for each frequency and for each node as well as the frequency response of meshed networks. The results can be displayed both in the frequency and time domain and serve as basis for the planning of ripple control systems, dimensioning of compensators (SVC) and harmonic filters, determination of network impedance for sub-synchronous resonance or filter design.
General Characteristics
- U-I and I-U sensitivity for each frequency
- Distributed parameter line model applied
- Frequency-dependence of elements is considered. Libraries available
- Automatic frequency step length control during impedance computation to detect resonances
- Calculation in the positive component system (symmetrical) or in the phase system
- Calculation of self- and mutual line impedances in function of the frequency
- Harmonic load flow (P, Q, I, U, losses)
- Results in frequency or time domain
Harmonic Levels
This module computes current and voltage at all frequencies and at all predefined nodes and elements as well as the r.m.s. values for harmonic voltages and currents with fundamental harmonic voltage or current taken from the Load flow (optional). Results are automatically entered in the single line diagram. Harmonic Analysis module also provides comparison of computed harmonic levels with the limit values laid down in any standards desired.
- Computation of total harmonic voltage factor in conformity with DIN/IEC and distortion factor in accordance with IEEE
- Computation of telephone parameters (TIF, IT, KVT) or transformer k-factor
- List output of ripple control currents and voltages at any desired frequencies and at each node and each element
- Harmonic sum calculation: vectorial, geometric, arithmetic, acc. to IEC 1000-2-6
Harmonic source
Harmonic sources (current and voltage sources) are entered directly in the single line diagram. They can be assigned directly to loads or any power electronic elements, such as Converter, SVC, PWM, etc. Libraries are available. Unlimited number of harmonic sources (current/voltage) can be computed with each harmonic, while any harmonic can be handled, e.g. inter-harmonics due to saturation effects.
Filter Dimensioning
Filter elements are dimensioned directly by NEPLAN and are transferred automatically into the single line diagram.
- Filter elements: filters (normal, HP, C-filter), series RLC-circuits with or without earth connection, ripple control traps
- Filter data are listed or saved in a text file
- Result lists can be saved in text files or in result files for evaluation by means of spreadsheet programs (like MS-Excel)
NEPLAN | Voltage Stability
back to overview
This module is an ideal tool to provide insight into the nature of voltage stability problems. It allows the examination of a wide range of system conditions providing four approaches for static voltage stability analysis of power systems: V-Q curves, P-V curves, V-Q sensitivity analysis and Q-V eigenvalue analysis (modal analysis).
General Characteristics
- Automatic calculation of P-V curves, V-Q curves, dV/dQ self-sensitivities, dV/dQ mutual sensitivities, eigenvalues, eigenvectors, bus participation factors, branch participation factors and generator participation factors.
- Result tables: results are presented in clear form and can be exported by Copy-Paste-methods to external programs (e.g. MS-Excel).
- Graphical results: results can be visualized by the fully integrated graphical results manager.
- Export files: results are stored in text files for advanced data export.
- Charts can be easily printed and exported to external programs (e.g. MS-Word) by clipboard functions. A variety of chart options is available.
- Input: standard load flow input data
Applications
- Identification of weak / not controllable / unstable areas
- Identification of weak and heavily loaded links
- Proper distribution of reactive reserves in order to maintain an adequate voltage stability margin
- Voltage sensitivity information
- Degree of voltage stability
- Most effective measures in improving voltage stability
NEPLAN | Net Transfer Capability (NTC)
back to overview
This module calculates the limiting MW transfer value between two control areas (source and sink) that is available without any violation of security limits.
General Characteristics
- ENTSO-E methodology (load flow based, MW generation shift)
- Large flexibility in limit handling (individual activation of limits)
- Consideration of user-defined contingency scenarios
- Consideration of Transmission Reliability Margin (TRM )
Results
The outcome of the calculation is a list of the limit violations for every step of increasing the MW transfer from source to sink as for
- the base case
- each contingency case
The module provides calculation of the Total Transfer Capacity (TTC) and the Net Transfer Capacity (NTC).


