NEPLAN | Data management
back to overview
The handling of the data management in the asset management module is highly flexible.
- Use a NEPLAN file as database: perform asset management calculation on your already modeled networks
- Or use a stand alone database (SQL-Server, Oracle) to store your data
- Smooth import of NEPLAN calculation results and asset data
- Import assets from any format (Shape files (from GIS), Excel, .csv, .txt, .xml, MS-Access, ODBC …)
NEPLAN | Operational Asset Management Module
back to overview
Due to radical changes taking place in the energy markets the affected companies feel a constantly rising pressure to cut costs. Among others, there is considerable potential for this in the field of maintenance. Selecting a suitable maintenance strategy can result in a substantial reduction of maintenance costs without putting the required functionality at risk.
In order to achieve the required cost savings, an individual, accurate and verifiable valuation of assets is essential. This module allows the user to evaluate each asset with a self defined assessment system and realize an effective short and middle term maintenance planing.
General Characteristics
- Data can be stored in any database (e.g. Oracle, MS-Access, SQL Server etc.) or directly in a NEPLAN file
- Allows easy integration to existing ERP systems (e.g. SAP)
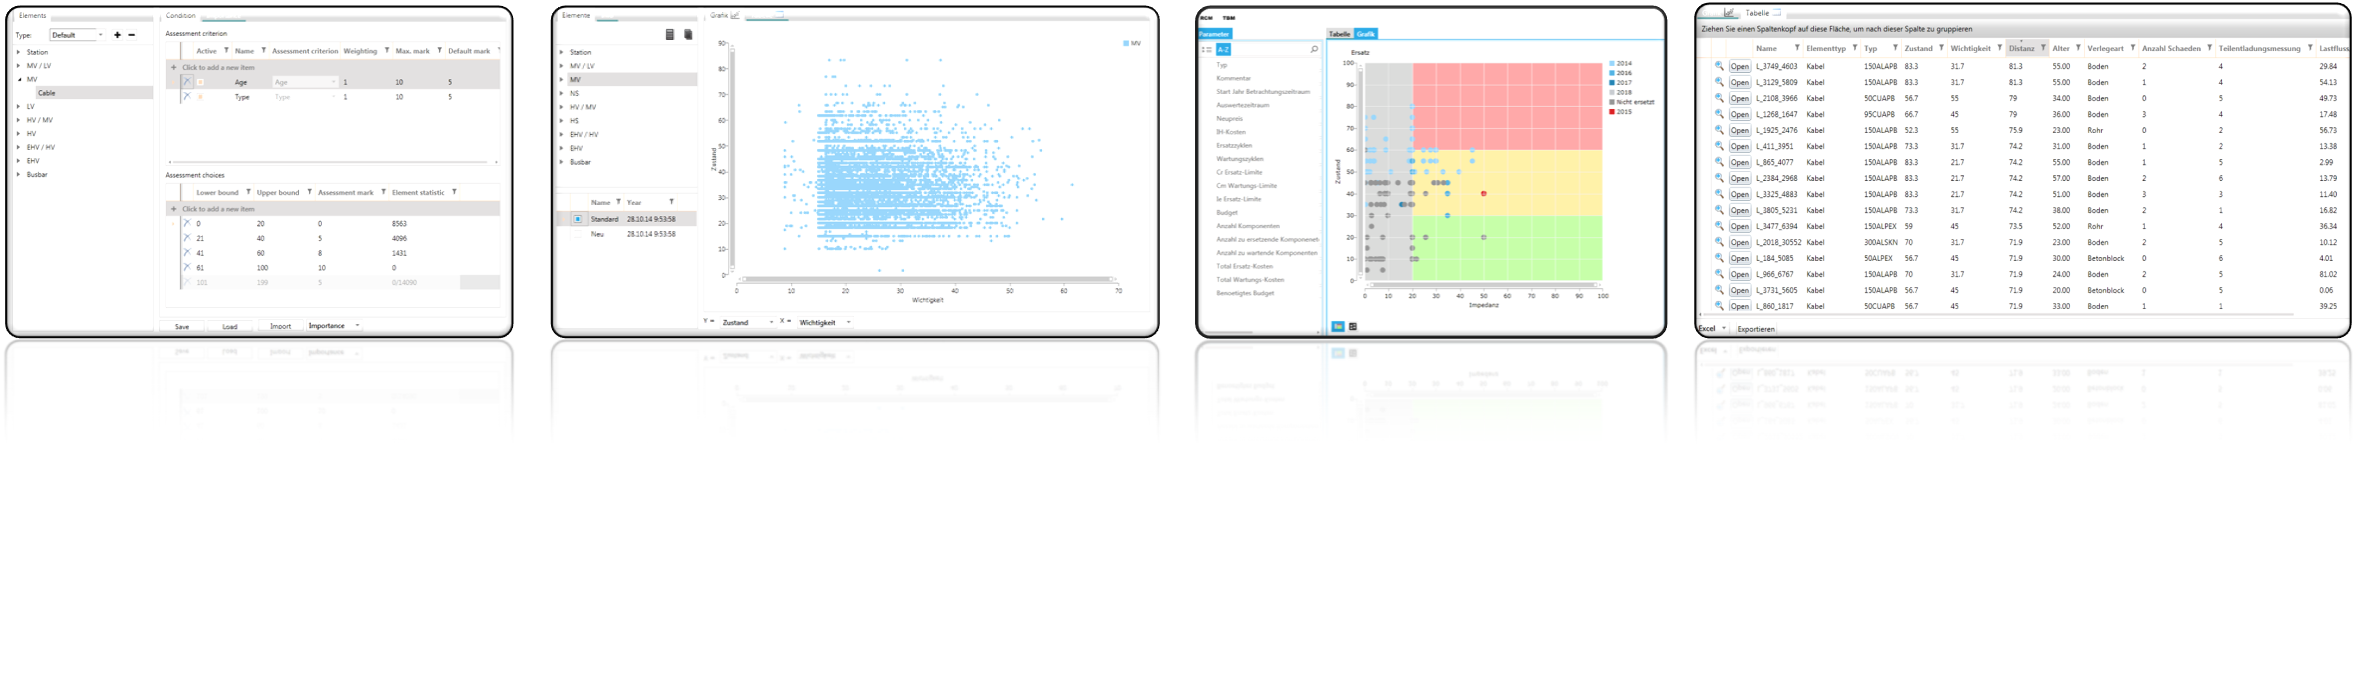
- Assessment criterion can be added or changed by the user
- Allows quickly to assess the conditions of the components
- Different charts give a useful overview over the overall conditions of the components
- A budgeting evaluation tools is available, which calculates the costs for the following maintenance strategies:
- TBM Estimation (estimated time based maintenance)
- TBM (time based maintenance)
- CBM (condition based maintenance)
- RCM (reliability based maintenance)
- Integrates smoothly with our famous NEPLAN-Reliability module
- Using the RCM module in NEPLAN any calculation result can be used to calculate condition or importance (e.g. use calculated loadings for lines, ENS (Energy Not Supplied), … )
- Can be excellently used for reinvestment strategies
Results
Due to NEPLANs up-to-date technology and advanced visualization functions the evaluation and processing of results was never easier.
- Display asset valuation results for each asset individually
- The style of each diagram is customizable and can be saved and reloaded if necessary
- Show results in diagrams or tables
- Export of tables to ASCII files or MS-Excel
- Export of diagrams to jpeg
NEPLAN | Strategic Asset Management Module
back to overview
The definition of strategies for mid and long term investments is an important task of the asset simulation process. The goal is to ensure the required functionality and quality of the complete system as cost efficient as possible. Aside from cost efficiency and quality aspects, other economic indices such as DCF (Discounted Cash Flow) play a key role in forming the best strategy.
For that reason it is essential to use a flexible and dynamic tool, which is not only able to model the complex behavior of aging assets but also to depict economic developments (e.g. interest rates), possible business decisions (e.g. Budgets) and their implifications.
General Characteristics
- Simulation of any kind and number of assets (network, power plant, … equipment)
- Free definition of asset groups (model a substation to the last screw or group equipment if suitable)
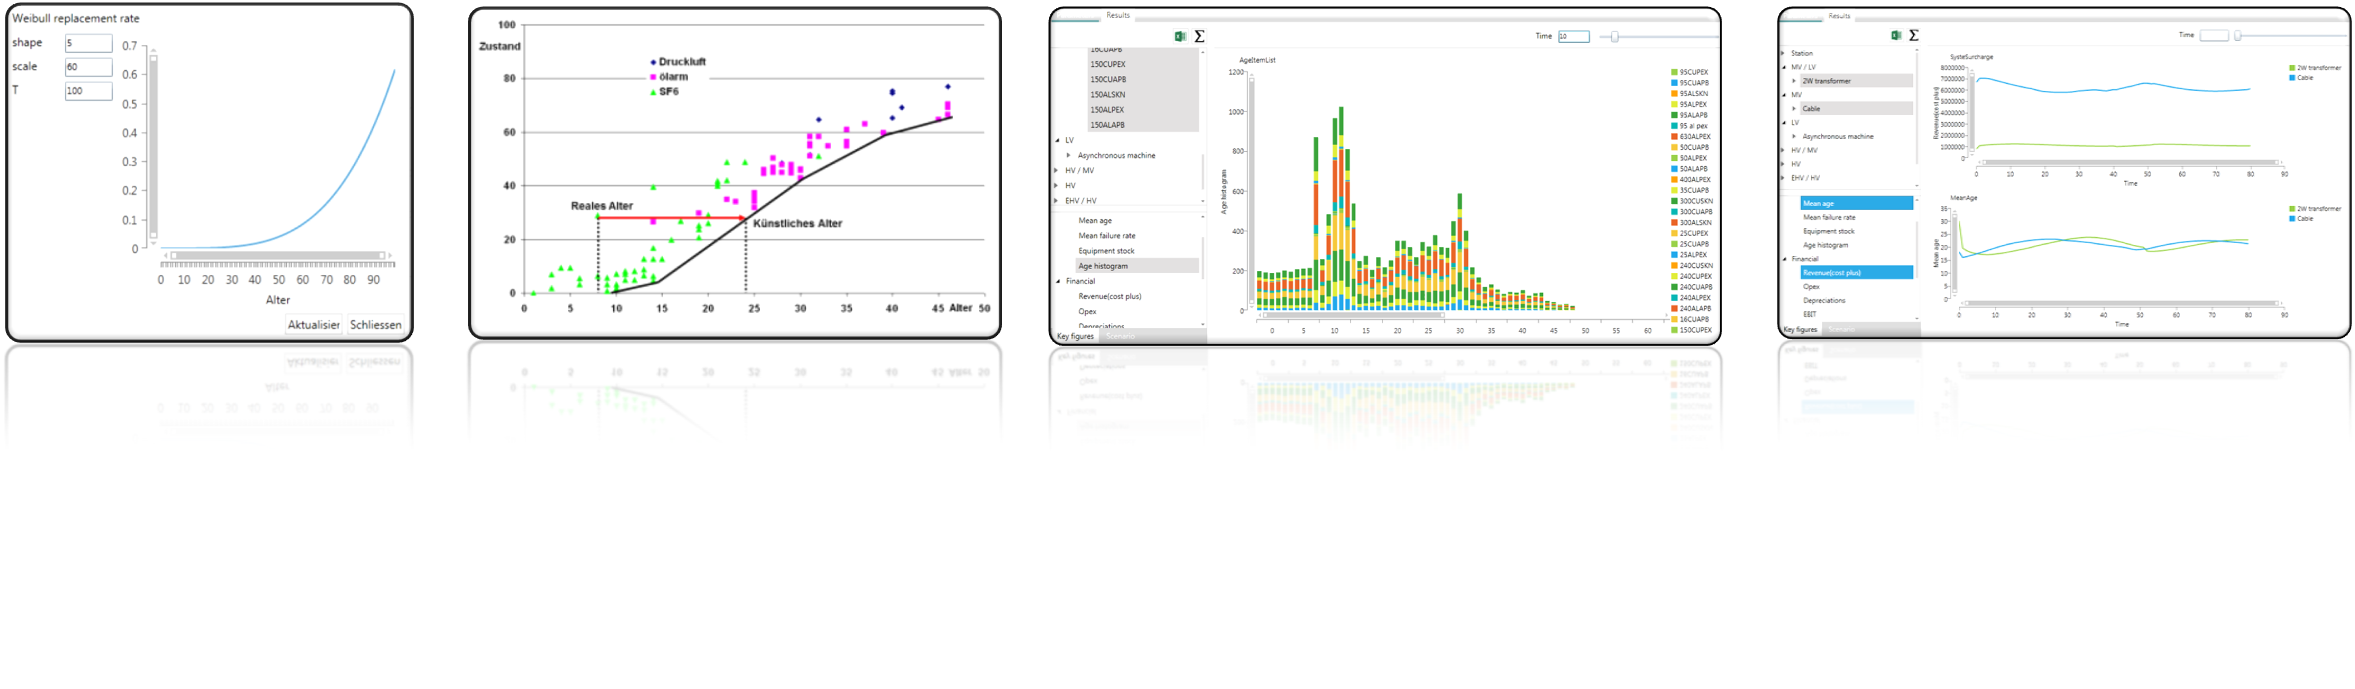
- Various simulation methods (statistical-, condition-, age-based or categorization in condition classes)
- Input time depending parameters (model rising interest rates, costs, …)
- A scenario manager is available to examine the impact of uncertainties (uncertainty in interest rates, costs, life time expectancy…)
- Calculation of sensitivities for each asset simulation input parameter possible
- Option to define time dependent or condition bases maintenance measures
- Define your own maintenance measures with age depending cycles and the possibility to model the feedback on asset condition
- Model possible reductions or substitutions of assets (e.g. substitute overhead lines for cables )
- Budgets can be entered hierarchically, time dependent and for each asset group individually
- Define your own tree of key figures adding new key figures if desired
Results
Due to NEPLANs up-to-date technology and advanced visualization functions the evaluation and processing of results was never easier.
- Display asset simulation results of self defined asset groups as a whole or for each asset individually
- Customize the representation of asset simulation results using drag and drop to show several key figures at once
- The style of each diagram is customizable and can be saved and reloaded if necessary
- Show results in diagrams or tables
- Export of tables to ASCII files or MS-Excel
- Export of diagrams to jpeg
NEPLAN | Heating/Cooling basic module / Contingency analysis
back to overview
This basic module enables the user to model, design and optimize his heating or cooling network using NEPLAN’s user friendly graphical interface and NEPLANs powerful, up-to-date calculation algorithms to address a wide range of applications.
General Characteristics
- Loads (consumers) can be changed through 3 different load factors (general, regional or simultaneity load factors).
- To each pipe any number of line loads can be connected (e.g. houses, heating …). Importing of consumers from existing databases (e.g. from an accounting database) is possible.
- All load and simultaneity factors of the line loads are considered during the calculation.
- The consumptions can be entered in different units (e.g. l/s m3/h, kW, t/h, etc).
- Simultaneous calculation of multiple partial networks (independent networks).
- Calculation of heat exchanger, heat plant, centrifugal and circulation pumps, reservoirs, valves, fittings, pressure regulators, etc.
- All elements have a temperature dependent thermo hydraulic model.
- It is possible to calculate only the forward flow. The return network must not be entered.
- It is possible to enter also the return network and calculate the forward and return network together.
- The calculation can be done without temperature losses. This can help to debug the network model.
- A powerful up-to-date calculation algorithm (Extended Newton Raphson) is implemented. This allows very easily inserting new element models. The complexity of the models is no longer restricted.
- The head loss characteristics of the pipes are calculated according to Prandtl-Colebrook and Hagen-Poiseuille.
- A load library (household, industrial loads …) with different simultaneity factors can be defined.
- Sophisticated pump and valve models, which allows regulating pressure, flow, pressure differences at any node or element.
Results
Upon calculations, results are automatically displayed on the single line diagram while their content and graphical information can be customized. Result evaluation and processing is easier due to visualization functions:
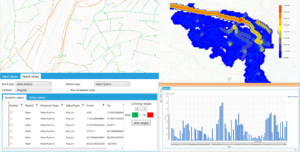
- Coloring according to variable ranges (e.g. velocity, flow, pressure-losses, pressure etc.)
- Highlighting of overloaded elements (e.g. velocity v > v max)
- Line width proportionally to many variables, including the flow and diameter
- Result output to an excel like table sheet, with copy/past possibilities to MS-Excel
- Result display in a charts (e.g. bar or line chart)
- Self-defined result output: the user can select units, variables, font, precision, placement
- Comparing results was never easier: Results from other variants can be displayed in the same result label and in the same chart
- Display the temperature, temperature losses and power losses in the diagram and in excel like table sheet
Contingency Analysis
Contingency analysis or N-1 analysis is used to determine the security of a network as well as the importance of the components. The outage list can include any element, and also common mode definitions are possible (simultaneous equipment failure). The basis of the Contingency Analysis is a fast heating/cooling network calculation. All defined outages are calculated and their impact is reported in terms of violations caused. The results can be viewed in tables and charts and the offered tools are aiding the engineers for the ranking of severity of each outage.
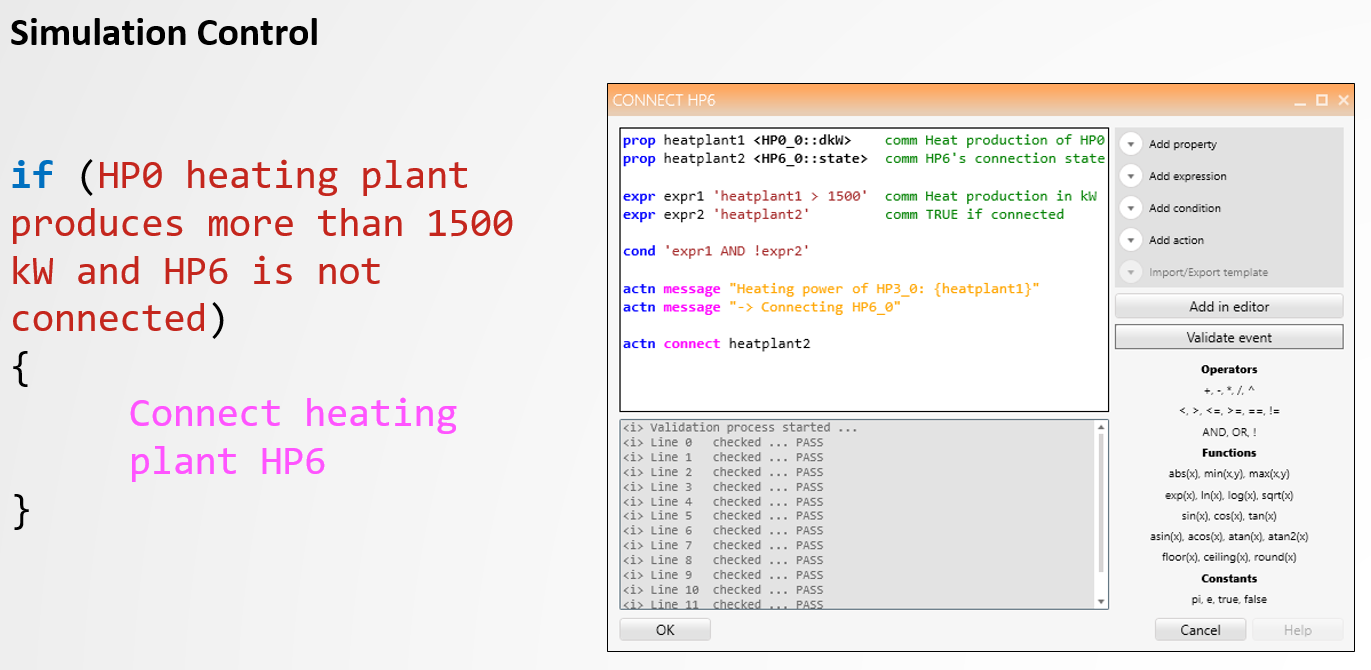
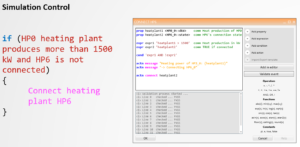
Remedial Actions (Event Definition)
The Remedial Action Schemes (RAS) is a separate module and could be licensed with the modules Heating Calculation and Contingency Analysis.
The user can define custom events for a series of heating or cooling network calculations. With the defined events, the status of the simulated network can be controlled, e.g. connect of a heating plant in case of limit violation so that the violation disappears. This module contains, beyond the standard control capability of the heating / cooling network calculation, powerful functions to observe and control the network.
NEPLAN | Fire water plan
back to overview
This module enables the user to calculate a complete fire fighting case on each node in the whole network.
General Characteristics and Results
- Automatic calculation of all node pressures with a given fire water demand Q
- Automatic calculation of all fire water demands of all nodes with a given node pressure P
- Coloring the diagram according to the results (demand Q or pressure P)
- Display the results in Excel like list format for user defined report generation
- Display the result in charts (with copy/paste possibility to MS-Word)
- Calculate all relevant data for one fire fighting case (e.g. max. velocity and the respective pipe, min pressure and the respective node etc.)
NEPLAN | Water basic module / Contingency analysis
back to overview
-1This basic module enables the user to model, design and optimize his water network using NEPLAN’s user friendly graphical interface and NEPLAN’s powerful, up-to-date calculation algorithms to address a wide range of applications.
General Characteristics
- Powerful, up-to-date calculation algorithms (extended Newton-Raphson)
- Simulation of any networks
- Simultaneous calculation of any number of partial networks (independent networks)
- Calculation with load factor profiles (day, week, season, weekdays, Sundays, long term, etc.)
- Import of measured consumption data
- Changing demands through global, regional or simultaneity load factors
- To each pipe any number of line loads can be connected (e.g. houses, industrial , …)
- Calculation of centrifugal and circulation pumps, reservoirs, valves, fittings etc.
- Sophisticated valve models
- Calculation of multiple pumps, tanks and reservoirs
- Calculation with different water temperatures
- Time dependent load and reservoir height characteristics (e.g. at night, or at noon, summer, winter etc.)
Results
Upon calculations, results are automatically displayed on the single line diagram while their content and graphical information can be customized. Result evaluation and processing is easier due to visualization functions:
- Coloring according to variable ranges (e.g. velocity, flow, pressure-losses, pressure etc.)
- Highlighting of overloaded elements (e.g. velocity v > v max)
- Line width proportionally to many variables, including the flow and diameter
- Result output to an excel like table sheet, with copy/past possibilities to MS-Excel
- Display of results in charts (e.g. bar or line chart)
- Result comparison: Results from other variants can be displayed in the same result label and in the same chart
Contingency Analysis
Contingency analysis or N-1 analysis is used to determine the security of a network as well as the importance of the components. The outage list can include any element, and also common mode definitions are possible (simultaneous equipment failure). The basis of the Contingency Analysis is a fast water pipe line calculation. All defined outages are calculated and their impact is reported in terms of violations caused. The results can be viewed in tables and charts and the offered tools are aiding the engineers for the ranking of severity of each outage.
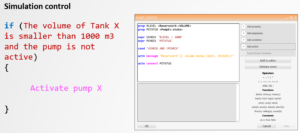
Remedial Actions (Event Definition)
The Remedial Action Schemes (RAS) is a separate module and could be licensed with the modules Water Calculation and Contingency Analysis.
The user can define custom events for a series of water pipe line calculations. With the defined events, the status of the simulated network can be controlled, e.g. dispatch of water supply in case of limit violation so that the violation disappears. This module contains, beyond the standard control capability of the water pipe line calculation, powerful functions to observe and control the water network.
NEPLAN | Time simulation
back to overview
This module enables the user to model time dependent processes using factor profiles or measurements for all consuming or supplying elements.
General Characteristics and Results
- Simulation of reservoir filling and emptying process
- Defining events such as: “if flow in pipe a below a certain value, disconnect pipe b”
- Simulation of any kind and size of networks
- No restriction on number of nodes and elements
- Simultaneous calculation of any number of partial networks
- Calculation with load factor profiles (day, week, season, weekdays, Sundays, long term, etc.)
- Import of measured consumption data
- Documentation of the processes in excel like table sheets and in user defined time diagram charts
- To each node an individual load profile can be defined (day, week, season, weekdays, Sundays, etc.)
- Considering time characteristics for reservoirs for supply, outflow and water height (day, week, season, weekdays, Sundays, long term etc.)
NEPLAN | Length profiles
back to overview
This module enables the user to display a two dimensional profile in a chart of any selected pipes in the network.
General Characteristics and Results
- Copy/Paste to the clipboard for documentation in MS-Word
- Color the selected pipes in the diagram
- The elevation and the absolute pressure is displayed in the chart
- The chart displays the correct proportion of the line length and the elevation
- Export the chart to a *.JPG file for any internet browser
NEPLAN | Gas basic module / Contingency analysis
back to overview
This basic module enables the user to model, design and optimize his Gas network using NEPLAN’s user friendly graphical interface and NEPLAN’s powerful, up-to-date calculation algorithms to address a wide range of applications.
General Characteristics
- Powerful, up-to-date calculation algorithms (extended Newton-Raphson)
- Computes pressures, flow rates and other operational quantities with excellent computational speed and accuracy
- Simulation of any kind and size of networks
- Sophisticated valve and regulator models
- Simultaneous calculation of different pressure zones (high, medium, low) and partial networks
- Compressible and incompressible gas calculation
- Calculation with user-defined operational states
- Calculation with synthetic profiles and/or field measurements
- Control of minimum system pressure
- Extensive scenario and operational state management
- Global, regional or simultaneity factors for demand changes
- Ideal for planning and comparative analysis
- Computes the minimum/maximum flow times of the fluid to reach any node in the network starting from a user-defined reference point.
- Evaluation of the mixture of the fluid of every consumer (feeder contribution)
- Temperature dependent loads are considered
- Handles pure hydrogen networks or networks of any combination of natural gas and hydrogen or other gas, e.g. biogas
- Tracking of calorific value
Results
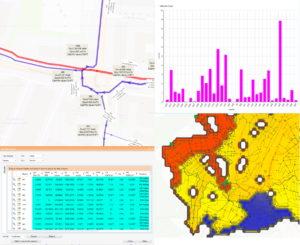
Upon calculations, results are automatically displayed on the single line diagram while their content and graphical information can be customized. Result evaluation and processing is easier due to visualization functions:
- Coloring according to variable ranges (e.g. velocity, flow, pressure-losses, pressure etc.)
- Highlighting of overloaded elements (e.g. velocity v > v max)
- Line width proportionaly to many variables, including the flow and diameter
- Result output to an excel like table sheet, with copy/paste possibilities to MS-Excel
- Display results in a sophisticated chart manager (e.g. bar or line chart)
- Comparing results was never easier: Results from other variants can be displayed in the same result label and in the same chart
Contingency Analysis
Contingency analysis or N-1 analysis is used to determine the security of a network as well as the importance of the components. The outage list can include any element, and also common mode definitions are possible (simultaneous equipment failure). The basis of the Contingency Analysis is a fast gas pipe line calculation. All defined outages are calculated and their impact is reported in terms of violations caused. The results can be viewed in tables and charts and the offered tools are aiding the engineers for the ranking of severity of each outage.
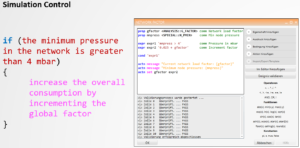
Remedial Actions (Event Definition)
The Remedial Action Schemes (RAS) is a separate module and could be licensed with the modules Gas Calculation and Contingency Analysis.
The user can define custom events for a series of gas pipe line calculations. With the defined events, the status of the simulated network can be controlled, e.g. dispatch gas supply in case of limit violation so that the violation disappears. This module contains, beyond the standard control capability of the gas pipe line calculation, powerful functions to observe and control the gas network.
NEPLAN | Motor Starting
back to overview
This module computes the motor start-up in unlimited networks and offers the possibility of simultaneous or time-delayed start-up for any desired number of motors. Motor Starting module can simulate different motor models, depending on the motor data entered and it also allows for start-up devices, such as star-delta starter, series resistor, transformer, soft starter, etc.
General Characteristics
- Identification of motor parameters using the least square method from input values for torque, current and cos(phi) in function of the slip
- Saturation and eddy-current losses in the motor allowed for (linear or point-by-point)
- Libraries for standard motor data, plus additional extendable libraries for Me(s), I(s) and cosphi(s) are available
- Operating point computation for all non-starting motors in accordance with their load characteristics (Newton-Raphson)
- Automatic tap changing transformers are allowed for after a user-defined time-delay
- Load torque entered as a characteristic or as a linear or quadratic load torque curve
- Extendable Libraries for load torques are available
Voltage Drop
This option calculates the voltage drop at time t=0.0 due to starting motors, thus less motor data and computation parameters have to be entered. Non-starting motors can be simulated by a user-defined load PQ (constant power) or shunt. Results of Voltage Drop Calculation are easily accessible:
- Overloaded elements, measuring instruments and protective devices or nodes with voltages outside a defined range are highlighted
- Results of the voltage drop computation are displayed in the single line diagram
- The motor data entered and the motor parameters computed can be accessed by clicking on the motor concerned in the single line diagram
Results
Results contain information on preselected nodes and elements. Also, graphical output of the characteristic curves and time characteristics is provided. Results display (dimensioning, scaling, colors etc.) can be customized.
- Computation of voltage U(t) at predefined nodes and of l(t), P(t), Q(t) for predefined elements
- Computation of motor current I, load torque M, electromagnetic torque Me, active power P and reactive power Q as functions of time, or of the slip for starting-up and non-starting-up motors
- Result lists can be saved in text files
- Results can be saved in result files for evaluation by means of spreadsheet programs (such as MS-Excel)